Studio
XFL Studio or Studio is the main element of FlowCoder IDE. It allows to quickly build a packet driven state machine for live testing of supported networking stacks.
Q: What network stacks/protocols are supported by FlowCoder today?
A: If you can decode the stack with WireEdit, it is supported by FlowCoder.
Studio includes a visual Flowchart editor, a step-by-step debugger with breakpoints, Execution Log, other debugging tools, Objects Browser with PDU templates.
Main Dialog
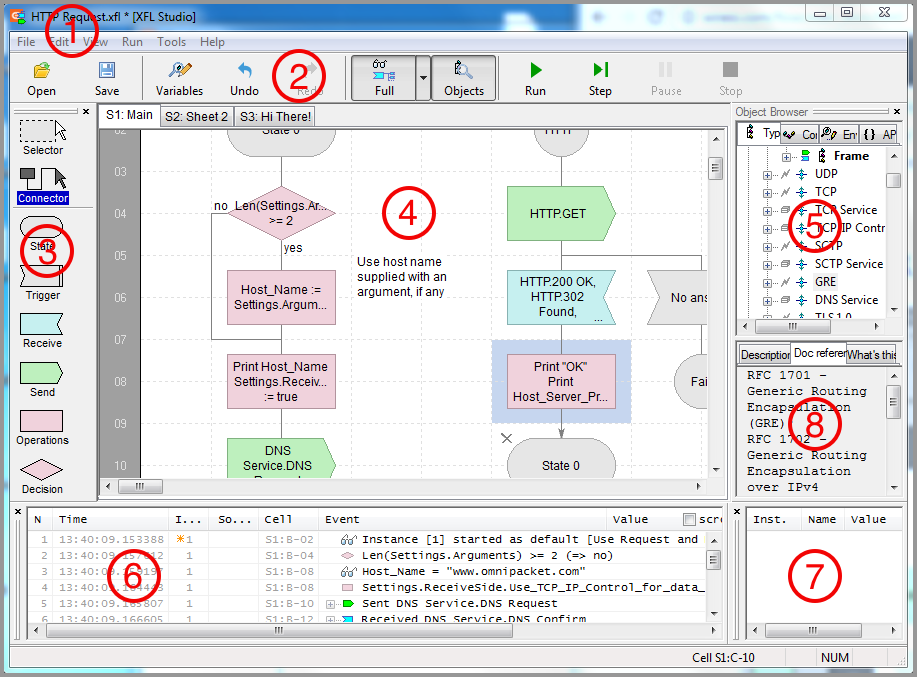
The elements of the dialog are:
- Menu Bar
- Toolbar
- Toolbox
- XFL Canvas
- Objects Browser
- Execution Log
- Data Watch
- Help
Menu Bar
File
- New… – Create new Flowchart
- Open… – Open new Flowchart
- Save – Save Flowchart
- Save As… – Save under the name
- List of recently opened docs
- Exit
Edit
- Undo – Discard last change
- Redo – Return last discarded change
- Cut – Cut the selection and save it into an exchange buffer
- Copy – Copy the selection into an exchange buffer
- Paste – Paste the content of an exchange buffer
- Paste Inverted – Paste Send as Receive and vice versa
- Mark with Color – Color the background of selected Block(s)
- Clear Color – Clear background of selected Blocks(s)
- Select All – Select everything
- Delete – Delete selection in worksheet
- Delete All – Delete everything on worksheet
- Find… – Open search dialog. Search is supported in Flowchart editor, in text script editor, Execution Log and Object Browser. In case of Flowchart editor, search results are shown in Execution Log. Can be called with Ctrl+F.
- Find Next – Find next entry of the search string. Can be called by F3.
- Replace… – Replace a string with another string in code
- Find in Files – Find in all script files in the specified folder
- Move to Next Trace Line – Move to next line in trace
- Advanced
- Make Selection Uppercase – convert the selected code fragment to upper case
- Make Selection Lowercase – convert the selected code fragment to lower case
- Shift Selection To Right – move the selected code fragment to the right
- Shift Selection To Left – move the selected code fragment to the left
- Variables List… – Open Variables List
- States List… – Open States List
- Timers List… – Open Timers List
- Procedures List… – Open Procedures List
- Sheets
- Add New Sheet – Create new worksheet
- Delete Sheet – Delete current worksheet
- Rename Sheet – Rename current worksheet
- Move Sheet Left – Move current worksheet right
- Move Sheet Right – Move current worksheet left
- XFL Includes…
View
- Output Pane
- Output Details Level
- Object Browser – Toggle Object Browser view
- Watch Pane
- Toolbar – Toggle Toolbar view
- Toolbox – Toggle Toolbox view
- Status Bar – Toggle Status Bar view
- Zoom In
- Zoom Out
- Zoom Normal
Run
- Go – Compile and Run
- Step – Execute step-by-step
- Pause – Pause execution, keep focus on the last executed element
- Stop – Stop test
- Add/Remove a breakpoint after current Block
- Remove All Breakpoints
- Execution Platform — Select node to execute on
- Check Constraints – Default value of check constraints functionality (On/Off). Dynamically changeable during execution.
- Verify – Verify Flowchart on syntax correctness
- Save Log… – Save Execution Log contents as text file
Tools
- Packet Wizard
- Add Packet
- Edit Packet
- Delete packet
- Options – Configuration options
- Advanced
- Recompile - Fast recompilation of large Flowcharts
Help
- Online Documentation
Toolbar
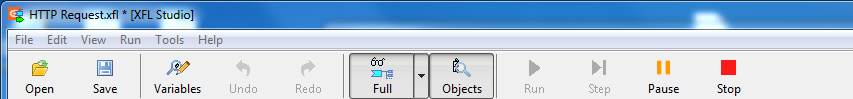
- Open – Open Flowchart file
- Save – Save Flowchart file
- Variables – Open Variables dialog.
- Undo – Undo last change
- Redo – Redo last change
- Full/Brief/… – Select output details level
- Objects – Toggle Object Browser view
- Run – Compile and Run
- Step – Step through execution
- Pause – Pause execution
- Stop – Stop execution
Toolbox
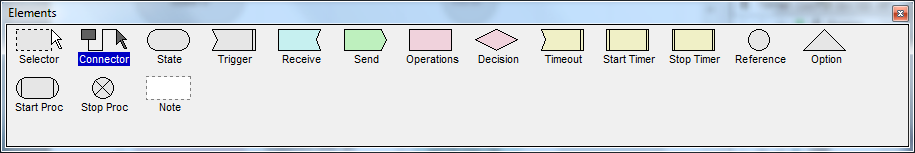
Toolbox allows to build a Flowchart with drag-and-drop operations. It includes tools for selecting, moving and connecting Blocks.
XFL Canvas
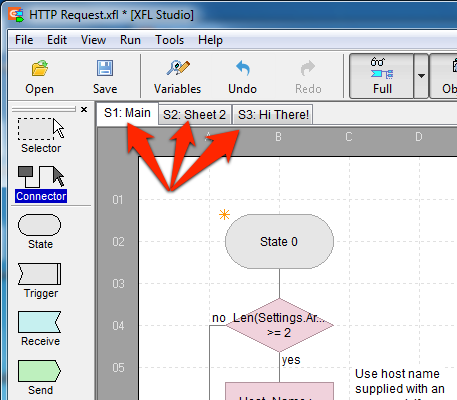
XFL Canvas is the pane in the center of the Studio window where a Flowchart is drawn. XFL Canvas may have multiple tabbed worksheets. All worksheets belong to the same Flowchart. A new XFL Canvas is created with the initial empty worksheet S1: Main. Additional worksheets can be added from a context menu of the existing worksheet tab or by selecting Edit >> Sheets command from the main menu. Flowchart fragments spread over multiple tabbed worksheets belong to the same Flowchart. State Blocks and Reference Blocks link them together.
Objects Browser
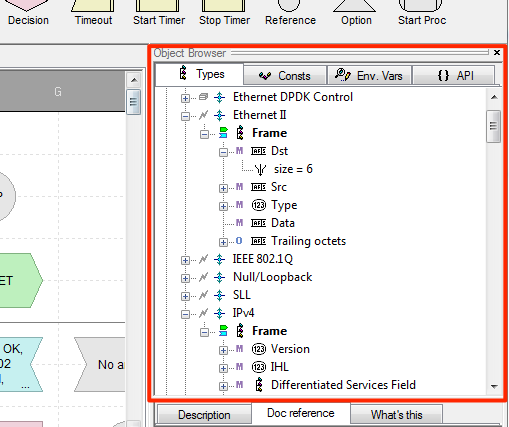
Objects Browser is a vertical pane at the right side of the Studio window. It provides a hierarchical view of all PDUs defined for supported protocol layers. The pane allows user to interactively navigate through the descriptions of the protocol fields, and look up the types, default values, constraints, etc.
One can Copy/Paste PDUs from Object Browser to XFL Canvas to create boiler-plate Send and Receive Blocks for the PDU.
Execution Log
Execution Log pane is a horizontal pane at the bottom of the Studio Window. It displays detailed real time debugging data.
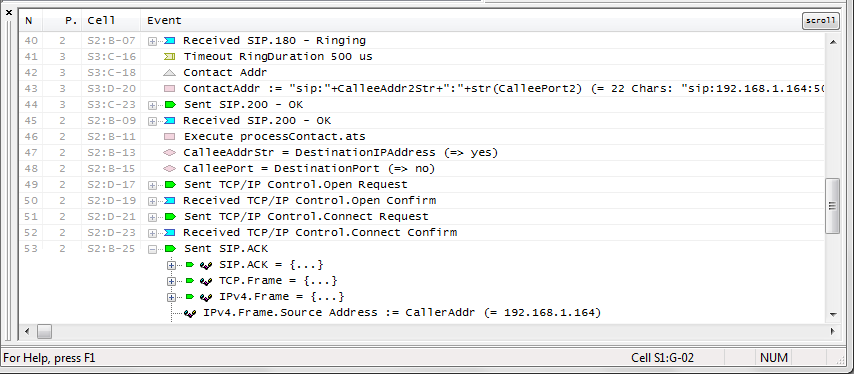
See more on Execution Log…
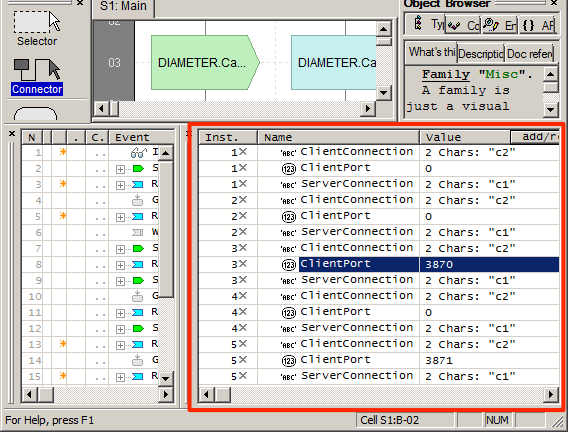
Data Watch
Data Watch pane is a horizontal pane at the bottom of the Studio Window on the right of Output pane. During execution it displays current values of variables in real time.