Debugging
Step-by-Step Execution
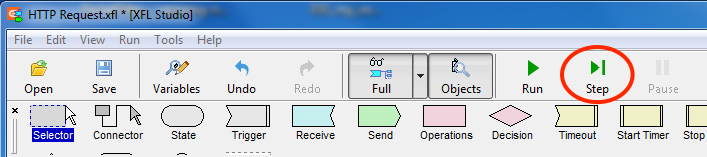
One can execute a Flowchart step-by-step by repeatedly pressing Step button on Studio toolbar.
Execution Log
During Flowchart execution Execution Log pane displays detailed real time log.
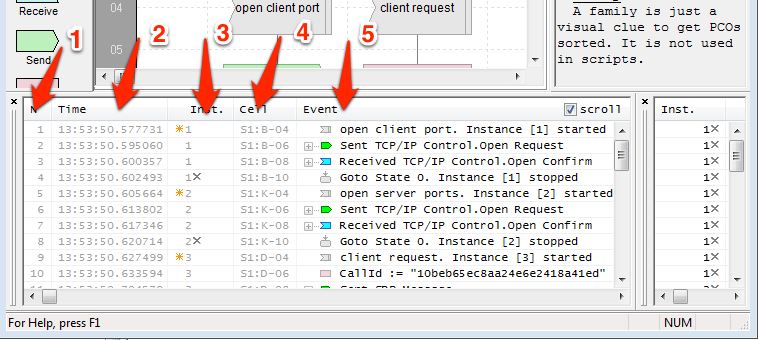
Execution Log data is organized in 5 columns:
- N - Event number
- Time - Time stamp. Disabled by default. See Show Timestamps.
- Inst. - instance number. The orange star of the left of the number indicates the first appearance of a new instance. The gray cross to the right indicates instance deletion.
- Cell - The address of a Block which generated the line in format: S
: - . For example “S1:B-04” indicates the element on the first worksheet, Column B, Row 04.
- Event - Event description
Selecting a line in Execution Log highlights the Block that has generated it.
Full Decode
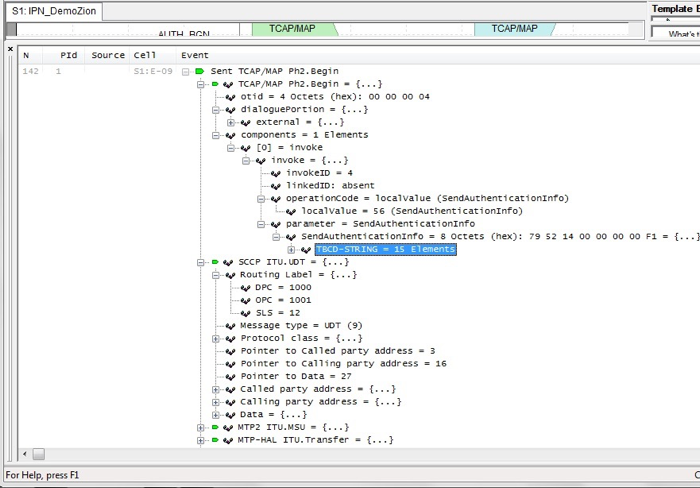
All PDUs sent/received are displayed in a fully decoded form. In order to see the “inside” layers of the message, click on the [+] icon next to the Execution Log line.
NOTE: Multiple receives for the same message
A line with a small blue Receive Block icon is added to Execution Log every time a PDU is received by an instance. If the same message to be received by multiple instances, Execution Log includes more blue “Receive” lines than the number of incoming packets processed by the Flowchart.
For a typical scenario, Flowchart should be designed so that each incoming message is handled by a single instance. The easiest way to achieve this is to have a unique Instance Key filter for Receive Blocks in each instance.
Details Level
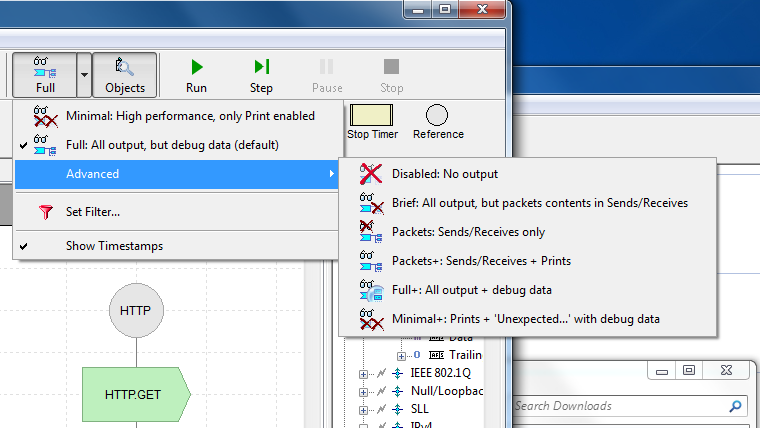
While in an interactive mode one can change the level of output from the main Studio toolbar. Clicking the downward pointing arrow on the right side of Details Level button opens a drop down list of all the supported output modes. One can select the mode manually before the start and change during execution. Only the output data generated after the change is affected. This selection could be dynamically overwritten by the instance themselves during execution.
Debug output slows down performance. For load tests select the “Disabled: No system debug output” option. If some output is absolutely required, minimize number and frequency of your Print operations and choose “Minimal” mode.
| Level | Description |
|---|---|
| Minimal | No auto-generated output. Output generated by Print operation in Operations Block is displayed. This mode can be used to display test results. If Print calls are infrequent (once a second or so), the mode could be used for load tests. |
| Full | This is the default. All output is enabled. |
| Disabled | Recommended when performance is important. Output is completely disabled. This is by far the fastest mode, and should be used for load tests. All other (more chatty) modes slow down the execution of the software to some degree. |
| Brief | All auto-generated except the messages (packets) sent/received. All user generated Print output is displayed as well. |
| Packets | The opposite of Brief mode. No auto-generated output, except the messages (packets) sent/received are displayed. User generated debug output is not displayed. |
| Packets+ | Packets mode plus output generated by Print function. |
| Full+ | Full mode plus debug output with details of incoming packets internal processing by every instance. This mode has been added to simplify debugging of Instance Key logic. |
| Minimal+ | No auto-generated output, expect for contents of “orphaned” arriving packets not received to any of the running instances. This mode has been added to simplify debugging of Instance Key logic for load test scenarios. Output generated by Print operation in Operations Block is displayed. If Print calls are infrequent (once a second or so), the mode could be used for debugging load tests. |
Disable Scrolling
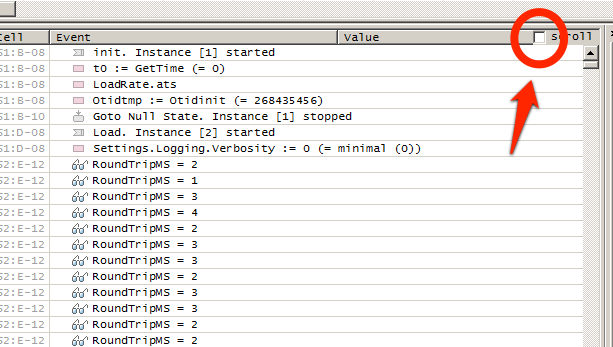
Disable scrolling to maximize speed. Scrolling eats up a lot of CPU time!
Set Filter
Filter the Execution Log output by instance number.
Show Timestamps
Enable Timestamps column in Execution Log.
Breakpoints
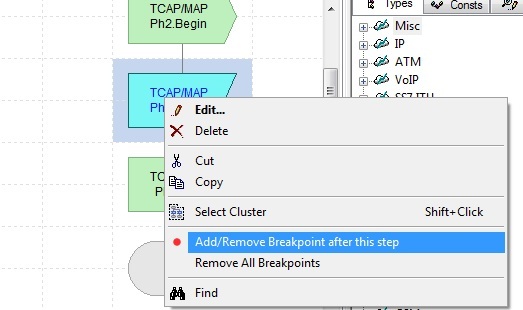
One can set a breakpoint at any Block via the context menu. The execution of all instances stops when any instance reaches a Block with a breakpoint. The Block with the breakpoint is fully executed before the breakpoint stops the execution. To continue execution, click Run button at the toolbar.
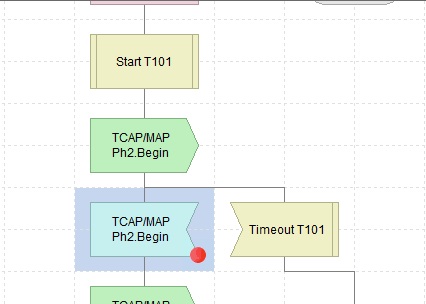
Blocks with breakpoints are visually marked with a red dot. When a breakpoint fires, the associated Block is highlighted.
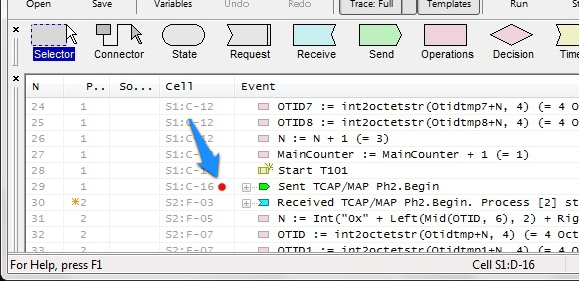
In Execution Log the trace line generated by a Block with a breakpoint is marked with a red dot. The mark persists after execution continues. This feature provides a complete visual history of breakpoints triggered during script execution.
Data Watch
The pane is used for dynamic display of variables values during run time. Any subset of variables can be selected for watching.
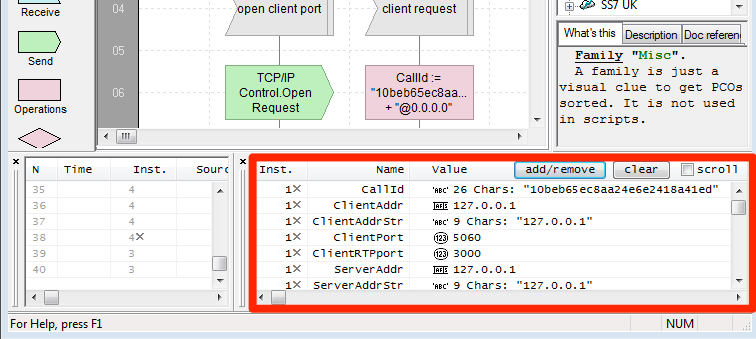
Button Add/Remove opens Variables List dialog. One could select for watching any subset of variables in the list.
At the top of the list are global variables. Below are local variables grouped by instance number. Each running instance except NULL Instance has its own independent set of local variables. If only NULL Instance is running and a local variable is selected for watching, the value displayed is “N/A”.
The list of variables in Data Watch belong to the IDE itself, not to the Flowchart. If a new Flowchart is opened, variables no longer present in the Flowchart are displayed as “N/A”.
Button Clear clears the watch list. To modify the list use Add/Remove button.
Scroll check box makes the Data Watch scroll to the bottom an additional of new lines. This functionality could also be enabled via Context Menu or with Esc key pressed.
Refresh of Data Watch happens when an instance executes a Block. If a variable changed its value while the Block execution, the variable’s entry in Data Watch list is colored in red. If a value does not change, its momentarily colored in pink, and then changes back to black. This is convenient for step-by-step debugging.
instance Filter is shared with Execution Log. It can be configured via the Context Menu, or by a double-click on the instance number.
Print Command
In the interactive execution mode, Print command available in Operations Block sends the output into Execution Log at the bottom of the Studio main window. In the batch mode the same output is sent into a console window.
Formatting of the output can be done in two different ways: Auto and Custom.
Auto Formatting
“Format” check box NOT selected.
- Stand-alone variables, which are not part of an expression are printed as Var-Name=Var-Value (Var1 = 1)
- Stand-alone charStr variables are printed in quotes, with the name and numerical length prefix ( Var2 = 2 Chars: “ab” ).
- Backslash, CR and LF chars are printed in the escaped form: Backslash is doubled ( \ \ ), while CR and LF are printed as escaped Hex codes.
- Expressions (Var1+1, Var2+”c”) are evaluated and the results are printed ( _2_ , abc ). No formulas, lengths or quotes are printed.
- Arguments are separated with a comma and follow-up space
Custom Formatting
“Format” check box is selected.
User supplies a format string similar to the first argument of C programming language printf() function. The string may contain plain text printed as is and the special formatting elements controlling the output form of the Print arguments. If there are more arguments to be printed than formatting elements present in the string, “Auto” mode is used for the extra ones. In this mode there is no difference between “stand-alone variables” and “expressions” output formatting.
The formatting elements have the following form with optional parts in []:
% [Flags] [Width] [Precision] [{F, L, Q }] Type
Only Type element is mandatory
Flags
| Value | Does what? |
|---|---|
| - | Left align the result within the given field Width (right align by default). |
| + | Prefix the output value with a sign (+ or -) (- sign appears only for negatives by default). |
| ‘ ‘ | Prefix the output value with a space if the value is positive (ignored if ‘+’ flag appears). |
| 0 | If Width element is prefixed with 0 flag, zeros are added (instead of blanks) until the Width is reached. |
Width
Minimal number of characters in the output. If less than Width number of characters are available, spaces are added.
Precision
Minimum number of digits for integers. The number of digits after decimal point for floats.
{F, L, Q }
Special modifiers not supported by C printf() function. More than one flag can be used.
| Value | Does what? |
|---|---|
| F | Prints Formula for this argument (i.e. Var2 = ab instead of just _ab_) |
| L | Prints Length for charStrings, octetStrings, bitStrings (i.e. 2 chars : ab instead of just _ab_) |
| Q | Prints Quotes for charStrings (i.e. “ab” instead of just _ab_ ) |
The modifiers can be used together (i.e. %FLQs results as: Var2 = 2 chars: “ab” - same as in Auto formatting)
Type
Mandatory. Determines how an argument is interpreted.
| Value | Does what? |
|---|---|
| s | String |
| d | Decimal Integer |
| f | Float |
| X | Hex |
| x | Hex |
| o | Octal |
One can print ALL arguments with %s specification, but other types allow some useful options (see above).
In this mode “Print in column” check box is ignored. Instead you can use “ “ sequence in the format string to make a new line in the output. That way one can have any number of lines in one Print output.
Example: For Print op with 4 arguments: Var1(=1), Var2(=ab), Var1+1, Var2+”c”. See the table below:
| Format String | Output |
|---|---|
| %s, %Qs, %Fd, %s | 1, “ab”, Var1+1 = 2, abc |
| Var1 = %6d; Name: %5s; %7.2f; %s | Var1 = 1; Name: ab; 2.00; abc |
| Var1 = %0.6d; Name: %-5s; %7.3f; | Var1 = 000001; Name: ab ; 2.000; abc |